With the playoffs starting tonight, I've been scrambling for the last few days to make my picks and get rosters sent in for various pools as I'm sure all of you have. While creating my playoff bracket, I got curious about what percentage of series go to 4, 5, 6 or 7 games. A few minutes in excel had it figured out, so follow after the jump for series length since the start of the current playoff format, plus playoff brackets from me, Bcapp, and JPNikota.
Wednesday, 11 April 2012
Tuesday, 10 January 2012
Shot Differential Chart for Leafs vs Wings 1/7/12
Hey guys, back again with some more BW Charts for you. Been experimenting with ways to get the goal lines on the charts, and I think I've figured out a way to do it. With that out of the way, here are the shots and shot differential charts for Leafs vs. Wings, 1/7/12.
As you may remember, this was a game that the Leafs didn't really deserve to win. The team got out to a good start, building up a 3 goal lead in the process. After that, Detroit was mostly driving the play and keeping us in our own zone. To our credit, we did a good job keeping shots to the outside and Gus put in a solid performance. After Lupul scored to put us ahead with 12:50 to play, score effects are very noticeable, with Detroit putting a flurry of shots on the Leafs net in the last 10 min.
Sunday, 8 January 2012
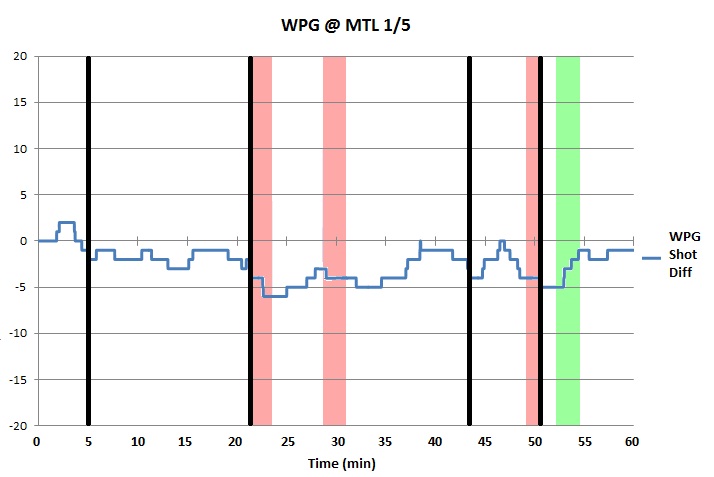
Shot Differential Chart for Leafs vs. Jets 1/5/12
Hello fellow Leafs fans. Been trying to think of an idea to get started with writing about the Leafs and hockey in general for a while, and I figured what better way that to shamelessly borrow an idea from the stat wizards over at Arctic Ice Hockey. I've been reading their stuff since before the Jets moved to the 'Peg and always liked how in depth they get with their stats while still making them understandable to us normal folk. When I first saw what Bettmans Nightmare has been calling a BW Chart, I thought it was a great way to visualize the flow of the game.
Those those of you that may not read AIH and have not seen the charts I'm referring to, here is an example of their chart for Leafs vs. Jets, 1/5/12 (disregard the error in the chart title). I decided to use this as a measuring stick for my own chart, which of course would have Leafs on top and Jets on the bottom, where they belong. The chart done by Arctic Ice Hockey also shows Leaf goals as black vertical lines, Jets PK as red shading, and Jets PP as green shading (this is something that I'm working on getting into my own charts, so any Excel ninjas out there can leave a tip in the comments if they know how).
Wednesday, 14 December 2011
Wilson's Leafs by the Defense

From Frank Gunn at AP via www.pensionplanpuppets.com
As a follow up to my previous post comparing the relationship between PK% and goals against, I will look at how this concept applies to the Leafs under Wilson.
Tuesday, 13 December 2011
Being Bad on the PK Means You're Bad Defensively... or Does It?
Hello hockey fans and welcome to my new blog, Bleeding Blue and White. While this is my first blog post, on my first self-run blog, I have been posting for a while over at PPP under the same name (BCapp). Thus if you enjoy this post please check out my page over there, for some of my older work. Now for my first post...
I recently had a discussion with other hockey fans where someone asserted that the Leafs under Wilson have been horrible defensively. I decided to look into the Leafs actual production under Wilson and I found that they have actually consistently improved their GA at 5 x 5, but their PK has continued to be horrible. I decided to analyze what the relationship is between total GA, GA at even strength (ES)*, and PK%. If this sounds interesting to you, continue after the jump!
*Note I used 5 x 5 statistics to represent ES. Technically ES can include 4 x 4 and 3 x 3 which I did not include.
Subscribe to:
Posts (Atom)